

Image & drafting by AI tools; Idea & Thinking by Suneeta
There is an enormous amount missing from that number.
Thirty percent is a good number. It is large enough to matter and small enough to believe. If a company says a new AI system improved productivity by 2%, most people will wonder whether the disruption was worth it. If it says productivity improved by 300%, people will start looking for the trick. Thirty percent sits comfortably between the two. It sounds substantial, plausible, measurable. A CEO can repeat it on an earnings call, a vendor can put it in a case study, a consultant can place it on a slide, and a journalist can use it in a headline.
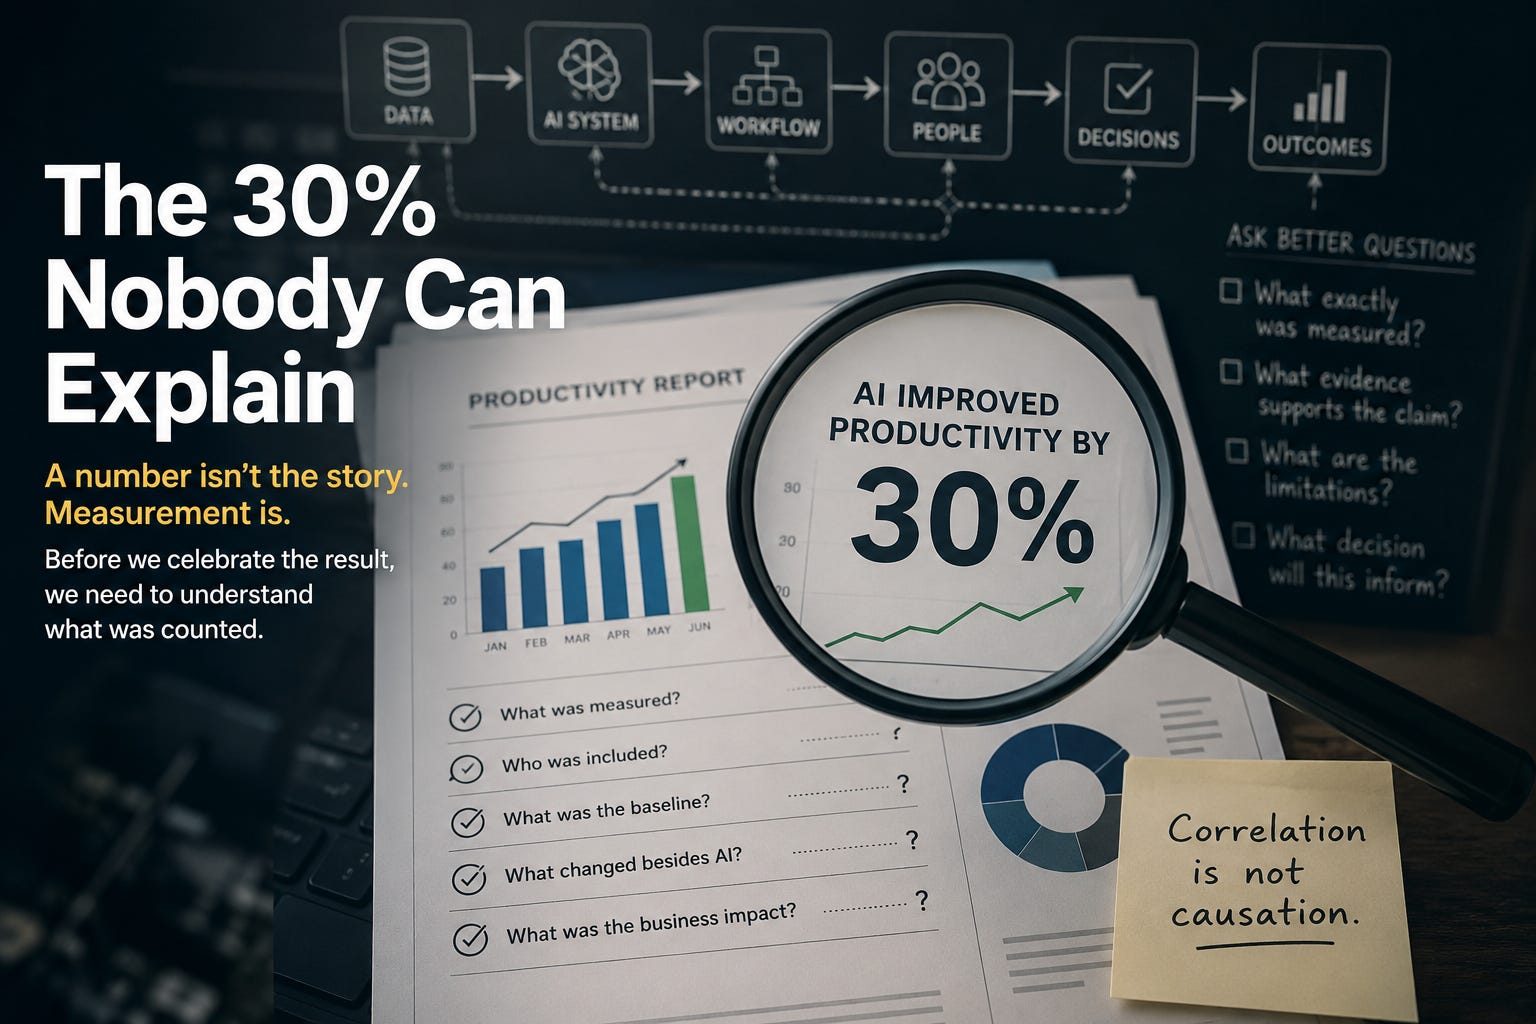
AI improved productivity by 30%.
Thirty percent of what, though, and measured against what? Over what period, across which people, doing what work, at what quality, with what excluded or included? And perhaps most importantly, what change produced the number?
These questions can sound unnecessarily technical when the result seems straightforward. If people completed more work after AI was introduced, surely productivity improved. Perhaps it did. But before a number can tell us something useful, we have to understand what was counted, and that is where many impressive numbers become considerably more interesting.
Start with the numerator
Imagine a company has 100 customer-service employees. Before introducing an AI assistant, each employee handles an average of 20 cases per day. After introducing it, they handle 26. That is a 30% increase in cases handled. The arithmetic is easy. The interpretation is not.
What counts as a handled case? Was it closed, or was it resolved? Did the customer contact the company again? Was the case escalated, and was the answer correct? Did another employee have to repair it later? Did customer satisfaction change, did compliance errors change, and did the complexity of the cases remain comparable?
If productivity means cases processed per employee per day, then the company may indeed have measured a 30% productivity increase. That is a valid statement about that particular metric. The number begins to change meaning, though, once it starts to travel.
The operations team may understand exactly what was measured. By the time the result reaches senior leadership, it may have become “the AI assistant increased productivity by 30%.” Then “AI increased workforce productivity by 30%.” Then, perhaps, “our AI investments are delivering 30% productivity gains.” The number remains the same while the claim around it gets larger.
This happens constantly in organizations, and not because people are necessarily trying to mislead anyone. Numbers compress information. That is one of their greatest strengths and also one of their greatest dangers. A complicated operational change involving hundreds of people, thousands of interactions, different types of work, exceptions, failures and adaptations can be compressed into one percentage. Thirty percent. The number becomes easier to communicate precisely because most of the conditions that produced it have disappeared.
What happened to the denominator?
We usually look first at the result. I have become increasingly interested in the denominator.
Suppose the AI assistant was offered to all 100 employees. Seventy used it regularly and thirty did not. Among the 70 users, output increased by 30%. What is the correct statement? “AI increased productivity by 30%”? “Employees using AI increased productivity by 30%”? Or “seventy percent of the eligible workforce adopted an AI tool, and those users processed 30% more cases”? Those sentences do not mean the same thing.
Now suppose the 30 employees who did not use the system were concentrated among the most experienced workers, because they found that it slowed them down. That changes the story again. Or perhaps the AI tool was useful only for routine cases, so employees reached for it when work was simple and avoided it when cases were complicated. Now the 30% might tell us something important about a particular class of work without telling us much about the operation as a whole.
This is not an argument against the number. It is an argument for knowing its boundaries. A denominator is not simply the number at the bottom of a fraction. It defines the population to which a claim belongs, and if you change the denominator you change the meaning of the result.
The baseline has a history
Now consider the other side of the comparison. Productivity increased by 30% compared with when? Last month, last quarter, the same quarter last year, the weeks immediately before deployment, a historical average, a control group, or a forecast of what productivity would otherwise have been? Each baseline tells a different story.
Suppose the company introduced the AI assistant in January. In December, employees handled 20 cases per day. In January, they handled 26. That is a thirty percent improvement. But December included holidays, staff absences and an unusual increase in complex customer requests, and January simply returned to normal. How much of the improvement belongs to AI? We do not know.
Reverse the situation. Perhaps the company introduced AI during its busiest season, when employees would ordinarily have handled 15 cases per day, and they handled 19.5 instead. Again, 30%. Now the same percentage may understate the operational value of the system.
Baselines are not neutral. They are choices. Sometimes those choices are obvious, and often they are inherited: an organization has been reporting a metric in a particular way for years, so the same method is used to evaluate the new technology. But AI often changes the work being measured, and that creates an uncomfortable possibility. The old baseline may no longer describe the new system.
If AI takes over the simplest 40% of cases, the remaining human workload becomes more difficult. Suppose employees previously handled 20 mixed-complexity cases per day, and after AI absorbs the routine requests they handle only 14. Did productivity fall by 30%? Possibly not. The humans may now be doing substantially more difficult work. The unit called a case remained constant. The work inside the unit did not. That is a measurement problem hiding inside an operational success.
Faster is not always more productive
AI is very good at producing speed metrics: time to draft, time to summarize, time to respond, time to search, time to code, time to process. These are useful measures because they are observable, and they are tempting because they move quickly. If a task that took 30 minutes now takes 10, we can calculate the improvement immediately. But productivity is not identical to speed.
Suppose an employee previously spent 30 minutes writing a report. With AI, the first draft takes five minutes, and the employee then spends 15 minutes checking facts, correcting language and removing unsupported conclusions. The total is 20 minutes. That is still a meaningful improvement, but what exactly did AI save? Ten minutes, not 25.
Now imagine that the employee does not perform the review at all, because the AI output looks convincing. The task takes five minutes and the apparent productivity gain becomes enormous. Three weeks later, another team discovers errors in the report and spends an hour correcting them. Where does that hour get counted? Often it does not get attributed to the original AI-assisted task at all. It appears somewhere else in the organization.
That is one of the most difficult things about measuring technological productivity. Costs can move. A system makes one step faster by creating work somewhere downstream. The first team records a gain, the second team experiences a burden, and the organization may see both while its measurement system fails to connect them.
Work has edges
We like tasks with clean beginnings and endings. A call was answered. A claim was processed. A document was drafted. A ticket was closed. A prior authorization was reviewed. Real organizational work is rarely that clean.
Take a claim. From the outside it might look like one transaction moving from submission to payment. Inside the system, it may touch eligibility information, provider data, coding, authorization, clinical documentation, electronic transactions, policy rules, fraud controls, state requirements, vendor platforms, exception queues and human adjudicators.
Which part did AI improve? If a model makes one decision faster but increases exceptions downstream, what happened to productivity? If automation reduces manual review but requires more data preparation, what happened? If processing time falls but appeals rise, what happened? If claims are processed faster but provider calls increase because the explanations are unclear, what happened? The answer cannot always be expressed as one number. That does not mean we should abandon measurement. It means we need better measurement.
The visible work and the invisible work
Every technology creates visible and invisible labor. The visible work is easy to count. A clinician completes a note faster, a developer produces code faster, a customer-service representative drafts a response faster, an analyst generates a report faster.
The invisible work is harder. Someone configures the system. Someone checks permissions. Someone decides which data can be used. Someone reviews failures, someone updates workflows, someone handles exceptions, someone monitors outputs, someone retrains employees. Someone resolves disagreements between the AI system and existing policy. Someone explains a decision when the AI output cannot. Someone takes responsibility.
None of these activities necessarily mean the technology is failing. They are part of operating it. But if we count the labor saved by AI without counting the labor required around AI, we are not measuring the new system. We are measuring one favorable section of it.
This becomes especially important as AI moves from individual productivity tools into operational decision-making. Generating an email is relatively contained. Supporting a clinical decision is not. Neither is assisting with insurance authorization, recommending a staffing change, or evaluating financial risk. The closer AI gets to consequential decisions, the more organizational machinery surrounds it, and the model may be only one component of it.
What exactly is the system?
This question has been bothering me. When people discuss AI performance, the AI system is usually treated as the object being measured. How accurate is the model? How quickly does it respond? How much does it cost per query? How often is it used? How much time does it save? All of those are useful questions.
But an enterprise does not experience a model in isolation. It experiences a model embedded in an organization. There are data systems before it, people around it, workflows through it, policies constraining it, decisions after it and consequences downstream. There are exceptions, handoffs and third parties. There are old systems that cannot simply disappear because a new system arrived. There are people who know things the documentation does not, and people who do not know that a process changed. There are incentives, deadlines, regulators and customers. There is reality.
So perhaps the object we need to measure is not merely the AI system. Perhaps it is the AI-enabled organizational system. That is a much less convenient object, and it is also probably the one that matters.
A model can improve while the organization gets worse
Consider another hypothetical. A company introduces AI to classify incoming support requests. Before AI, average classification time was 10 minutes, routing accuracy was 90%, and average resolution time was 24 hours. After AI, classification time fell to 30 seconds, routing accuracy rose to 95%, and average resolution time rose to 27 hours.
Did the AI work? Yes. Did the operation improve? Not according to the final metric.
Why? Perhaps the AI generated more granular categories, which overloaded certain specialist queues. Perhaps employees trusted the classifications too much and stopped correcting borderline cases. Perhaps the system routed requests correctly but the receiving teams lacked capacity. Perhaps the faster intake simply created a larger downstream queue. Perhaps the model optimized the wrong bottleneck.
This is not unusual in systems. Improving one component does not guarantee improvement of the whole, and sometimes local optimization makes the total system worse. AI makes this particularly easy, because model-level improvements can be dramatic and measurable. We can demonstrate that classification became 20 times faster. That number is real. It simply does not answer the question leadership ultimately cares about, which is whether the organization became better at serving customers.
Adoption is another seductive number
Then there is usage. Organizations increasingly track AI adoption. Fifty percent of employees are using the approved AI assistant. Seventy percent. Eighty-five percent. This matters, because a tool nobody uses cannot create much value. But adoption itself is not value.
If 90% of employees use an AI assistant to rewrite emails, is the organization more capable? Maybe. If 40% use it for a high-value workflow that reduces turnaround time without reducing quality, perhaps that matters considerably more. Usage counts activity. It does not automatically count usefulness.
The same problem appears in training. An organization might report that 95% of employees completed AI training. Excellent. What does that establish? It establishes, assuming the records are correct, that 95% completed the training. It does not establish that 95% understand when they may use AI, that they would recognize a risky output, that they know when escalation is required, or that the workflow even allows them to act on what they learned. Completion is evidence of completion. We create trouble when we ask one measurement to prove something larger than it measured.
Evidence has jurisdiction
I think of evidence as having jurisdiction. A piece of evidence is allowed to establish some things and not everything.
A policy document can establish that a policy exists. It may establish what the policy says, and who approved it and when. It does not, by itself, establish that people follow it. A training record can establish completion, but not competence. A model benchmark can establish performance against a defined test, but not automatically performance in production. An employee survey can establish what employees reported, but not necessarily what they do. A productivity metric can establish a change in a defined unit of output, but not automatically business value.
The problem begins when evidence travels beyond its jurisdiction, and this happens easily because organizations need decisions. Leaders cannot inspect every underlying artifact themselves, so information must be compressed as it moves upward. A dashboard summarizes thousands of events, a KPI summarizes a process, a percentage summarizes a population, a score summarizes multiple measures. Compression is necessary. But every layer of compression creates the possibility that context will disappear faster than uncertainty does, and by the time a number reaches the person making the investment decision, it may look far more certain than the evidence underneath it.
What would make the 30% meaningful?
Suppose you are the CEO receiving the statement that your AI deployment improved productivity by 30%. You do not need to become a statistician, and you do not need a 70-page methodology report. You probably need a small number of additional facts. What was measured? Which population was included? What was the baseline, and what period was compared? What changed in quality? What work moved elsewhere? What did the AI cost to operate? What happened to the business outcome?
Those questions transform the number. Perhaps the answer is this: customer-service representatives using the AI assistant resolved 30% more Tier 1 requests per paid hour over 12 weeks compared with a matched group without the tool; repeat contacts remained statistically similar, escalations fell slightly, and operating cost per resolved request declined 18%.
Now we know much more. The 30% has boundaries, and those boundaries do not weaken the claim. They strengthen it. A well-bounded number is more useful than a larger vague one.
What if the result is only 8%?
This is where measurement becomes culturally difficult. Suppose careful analysis reduces the headline productivity improvement from 30% to 8%. That can feel disappointing. It should not necessarily be. An 8% sustained improvement across a large operation can be enormous, and more importantly, an 8% result that survives scrutiny is worth more than a 30% result nobody can explain.
Organizations often reward impressive numbers before they reward valid numbers, and that creates predictable behavior. Teams select favorable baselines. Pilot populations are treated as representative. Temporary effects become permanent claims. Time saved becomes productivity, productivity becomes ROI, usage becomes adoption, and adoption becomes transformation.
Nobody has to lie. Each translation only has to stretch the meaning slightly. By the end, a modest operational improvement has become evidence that the enterprise is succeeding at AI, and the arithmetic may have remained perfectly correct throughout. The measurement did not fail. The interpretation did.
ROI makes the problem harder
Eventually, most AI conversations arrive at ROI, and that is reasonable. Companies are not research laboratories, and investments must produce value. But ROI requires us to define both the return and the investment.
The investment is not always just software licensing. It may include integration, data preparation, security review, governance, training, workflow redesign, vendor management, human oversight, infrastructure, change management, maintenance, error handling, opportunity cost, and time.
The return may include labor savings, but even labor savings are more complicated than they appear. If AI saves every employee four hours per week, what happens to those four hours? Are fewer employees required? Is more work completed? Does quality improve? Does response time fall? Do employees spend the time on higher-value tasks? Or does the organization simply create four hours of theoretical capacity that nobody captures?
Time saved is not automatically money earned, and capacity created is not automatically value captured. There is an organizational step between them, and that step is frequently where the interesting story lives.
The organization has to convert capability into value
Suppose an AI tool genuinely saves an analyst five hours every week. That is a technological capability. For the company to capture value from those five hours, something else has to happen. The analyst must know what to do with the capacity. The manager must change expectations or workload. The workflow must accept additional output, and downstream teams must be able to absorb it. Performance measures may need to change. Roles may change. Perhaps staffing changes, perhaps service levels change, and perhaps nothing changes at all.
The same AI capability can therefore produce very different economic outcomes in two organizations. One converts the saved time into additional useful work and the other does not. If we evaluate only the AI tool, they may look equally successful. If we evaluate the organizational result, they are not.
This may explain part of the strange gap we see in enterprise AI discussions, where organizations simultaneously report impressive experiments and disappointing returns. Those two statements are not necessarily contradictory. The technology may be creating capability that the organization has not yet learned to convert into value.
The measurement should follow the decision
There is another way to approach this. Instead of asking what we can measure, start by asking what decision we are trying to make. Are we deciding whether to expand the deployment, renew the vendor, redesign the workflow, increase the budget, train more employees, change staffing, introduce additional controls, or stop the program altogether?
Different decisions require different evidence. A usage metric may be sufficient to decide whether awareness is a problem, but it is not sufficient to decide whether the investment is profitable. A quality benchmark may help decide whether a model is technically acceptable, but it is not sufficient to decide whether employees know when to override it. A training completion rate may help identify who has received the required material, but it is not sufficient to decide whether the organization can safely expand the use case.
Measurement becomes much clearer when it has a job. Without a decision attached to it, organizations accumulate dashboards. With a decision attached, the question becomes sharper: what would we need to know to make this decision responsibly? That is a much harder question, and it is also much more useful.
Precision can hide uncertainty
There is something psychologically powerful about numbers. “Productivity improved” sounds like an opinion. “Productivity improved by 30%” sounds like knowledge. Add a decimal and it sounds better still. “Productivity improved by 30.4%.” Now it feels measured, and perhaps it was. But precision and validity are different properties.
A bathroom scale that is incorrectly calibrated can report exactly 143.7 pounds every morning. It may be extremely consistent. It may also be wrong.
Organizations encounter versions of this constantly. The data pipeline is correct, the dashboard calculation is correct, the percentage is correct, and the thing being measured is not the thing leadership thinks it is. That is a more dangerous error than bad arithmetic, because it looks like good measurement. The number does not appear broken. Nothing throws an exception. The dashboard turns green and the presentation moves forward.
We need to become more comfortable with qualified numbers
Business culture often treats qualification as weakness. “We observed a 30% improvement among this population, under these conditions, during this period” sounds less confident than “AI improved productivity by 30%.” But the first statement contains more knowledge. Its limits are visible, which makes it easier to test elsewhere. It tells another team what might need to be true for the result to repeat, and it allows leadership to distinguish what has been demonstrated from what is still assumed.
That distinction matters enormously when an organization moves from pilot to scale. A pilot asks whether this can work. Scale asks whether it will continue to work when the surrounding conditions change: a different population, different managers, different data, different workload, different systems, different incentives, different exceptions, different levels of experience. The number that emerged from the pilot cannot simply travel unchanged into the enterprise. Its conditions have to travel with it.
This is not an argument for measuring everything
There is an obvious danger in the other direction. If every number requires 40 caveats, 17 controls and a doctoral dissertation, nobody will make a decision. Organizations cannot eliminate uncertainty, and nor should they try.
The purpose of measurement is not to produce perfect knowledge. It is to reduce uncertainty enough to make a better decision. Sometimes a rough number is sufficient. Sometimes a pilot is sufficient, or a survey, or expert judgment. Sometimes the organization needs much stronger evidence. The standard should depend on the consequence of being wrong, which is why the same measurement approach should not apply equally to an AI writing assistant and an AI system influencing clinical care. The stakes differ, and so should the evidence.
The number is not the conclusion
Return to our imaginary company. AI improved productivity by 30%. Maybe it did.
Perhaps, after examining the denominator, the baseline, the quality, the downstream work, the operating cost and the business outcome, we discover something even better: the AI assistant increased routine-case resolution by 30%, reduced average response time, maintained quality, lowered cost per resolution and allowed experienced employees to spend more time on difficult cases. That is a meaningful operational result.
Or perhaps we discover something less impressive. Employees processed 30% more cases, but repeat contacts increased, senior reviewers spent more time correcting errors, and the total cost per successful resolution barely changed. That is also useful knowledge.
Or perhaps we discover that the tool produced substantial gains only for inexperienced employees. That may be extremely valuable, because it tells the company where the technology belongs. Or perhaps experienced employees benefited most, which points to a different decision. Perhaps the tool works beautifully in one workflow and poorly in another. Again, useful.
Good measurement does not exist to make a technology look successful or unsuccessful. It exists to make the next decision less blind. That is why I am increasingly skeptical of naked percentages, and not because percentages are misleading. It is because they are unfinished. A percentage tells us the magnitude of a relationship we chose to measure. It does not tell us whether we chose the right relationship.
Ask one more question
We are going to see many extraordinary numbers about AI over the next several years. Productivity up 30%. Costs down 40%. Coding 55% faster. Customer service 60% more efficient. Seventy percent adoption. Ninety percent accuracy. Thousands of hours saved. Billions of dollars in value.
Some of these numbers will be wrong. Many will be perfectly accurate. The more interesting question is what they are accurate about.
That distinction is easy to lose because numbers look finished. They arrive with boundaries: 30%, 95%, $4.2 million. Those boundaries make the measurement look complete. But the real boundaries are usually elsewhere. They sit around the population, around the baseline, around the workflow, around the evidence, around the exclusions, around the period of observation, around the definition of success, and around everything that happened before and after the thing we chose to count.
So the next time someone tells me that AI improved productivity by 30%, I do not want to dismiss the number. I want to know more about it. Thirty percent of what? Compared with what? For whom? Under what conditions? And what happened to everything we did not count?
The answers might make the number smaller. They might make it larger. They might show that we were measuring the wrong thing entirely. Or they might turn a good-looking percentage into something much more valuable: a number we can actually use to make a decision.
This is why I always get suspicious whenever a vendor shows up with a slide deck boasting massive productivity spikes. The tech usually *is* faster at the micro-task... it's just that the chaos always seems to relocate somewhere else downstream.