
The Hidden Cost of "Good Enough" Data
Why Data Quality Problems Don't Announce Themselves Until It's Too Late


S came in looking frustrated.
“I’ve been trying to explain this to people at work,” S said, dropping into the chair. “What we talked about last week. About data being the real problem. About the six dimensions.”
“How’s that going?”
“They nod. They agree in principle. Then they say ‘but our data is good enough.’”
S made air quotes around “good enough.”
“And you don’t think it is?”
“I don’t know. That’s the problem. Nobody knows. Nobody’s measuring. They just assume it’s fine because nothing has visibly exploded.”
“Yet.”
“Yet,” S repeated. “So how do I show them what ‘good enough’ is actually costing?”
The Invisible Tax
Here’s the thing about data quality problems. They don’t announce themselves.
A server crash is obvious. An application error throws a message on the screen. A security breach makes headlines.
But bad data? Bad data just sits there. Quietly. Doing damage you can’t see.
Think of it like a slow leak in your roof. Water drips into the insulation. The wood starts to rot. Mold grows in places you never look. Everything seems fine from the inside. Until one day the ceiling collapses.
Data quality problems work the same way. They accumulate silently. They compound over time. By the time you notice something is wrong, the damage has spread far beyond the original source.
This is why “good enough” is so dangerous. It feels safe. It feels pragmatic. But it’s actually a bet. You’re betting that the problems you can’t see won’t become problems you can’t ignore.
Most organizations lose that bet eventually.
Where the Money Actually Goes
S leaned forward. “Okay, but can we put numbers on this? When I say ‘data quality costs money,’ people want specifics.”
Let’s get specific.
Gartner has estimated that poor data quality costs organizations an average of $12.9 million per year. But that number is abstract. It doesn’t tell you where the money goes.
Here’s where it actually goes:
Rework. This is the biggest one, and the least visible. Analysts spend time cleaning, correcting, and reconciling data instead of analyzing it. Studies suggest that data professionals spend 40 to 60 percent of their time on data preparation. Think about that. You’re paying skilled people good salaries, and half their time goes to janitorial work that shouldn’t be necessary.
Failed projects. Data science projects fail at a rate of 80 to 85 percent, depending on which study you read. Many of those failures trace back to data issues. The model couldn’t be trained because the data was insufficient. The model was trained but didn’t generalize because the training data didn’t represent reality. The model worked in testing but failed in production because nobody accounted for data drift. Each failed project represents months of work, significant salary costs, and opportunity cost of what those people could have been doing instead.
Bad decisions. This is the hardest to quantify but potentially the most expensive. When decisions are based on incorrect data, the costs show up downstream. A marketing campaign targets the wrong customers. A supply chain forecast misses actual demand. A hiring model screens out qualified candidates. A credit model approves risky borrowers. Each of these decisions made sense based on the data available. The data was just wrong.
Compliance failures. Regulators are increasingly asking organizations to demonstrate data quality. The EU AI Act requires that training data be “relevant, representative, free of errors and complete.” GDPR requires that personal data be accurate and kept up to date. When you can’t demonstrate compliance, you face fines. When you can demonstrate compliance but the documentation takes weeks to assemble, you face operational costs that add up quickly.
Eroded trust. This one doesn’t show up on any balance sheet, but it might be the most corrosive. When stakeholders stop trusting the numbers, they stop using them. Executives make gut decisions instead of data-driven ones. Analysts hedge their findings with so many caveats that the insights become useless. The entire investment in data infrastructure delivers diminishing returns because nobody believes the output.
The Compounding Problem
“That’s a lot of categories,” S said. “But they feel separate. Like different problems that happen to share a cause.”
“They’re not separate. They feed each other.”
This is the part that most people miss. Data quality problems don’t stay contained. They compound.
Here’s how it works.
Bad data enters your system at the point of collection. Maybe a form field wasn’t validated properly. Maybe an integration dropped some records. Maybe someone made a typo during manual entry.
That bad data flows into your data warehouse. Now it’s sitting alongside good data, and there’s nothing to distinguish them. Your warehouse doesn’t know which records are accurate and which are garbage.
An analyst pulls data for a report. They don’t know about the quality issues because nobody documented them. The report goes to leadership. Leadership makes a decision based on the report.
The decision turns out to be wrong. But nobody traces it back to the data. Instead, they blame the analyst’s methodology. Or the model. Or the market conditions. The actual root cause remains hidden.
Meanwhile, the same bad data is being used to train machine learning models. The models learn the patterns in the data, including the patterns that exist only because of errors. The models get deployed. They make predictions. The predictions inform more decisions.
Each step amplifies the original problem. A small error at the source becomes a medium error in the warehouse becomes a significant error in the model becomes a costly error in the real world.
“So fixing it later is always more expensive than fixing it early,” S said.
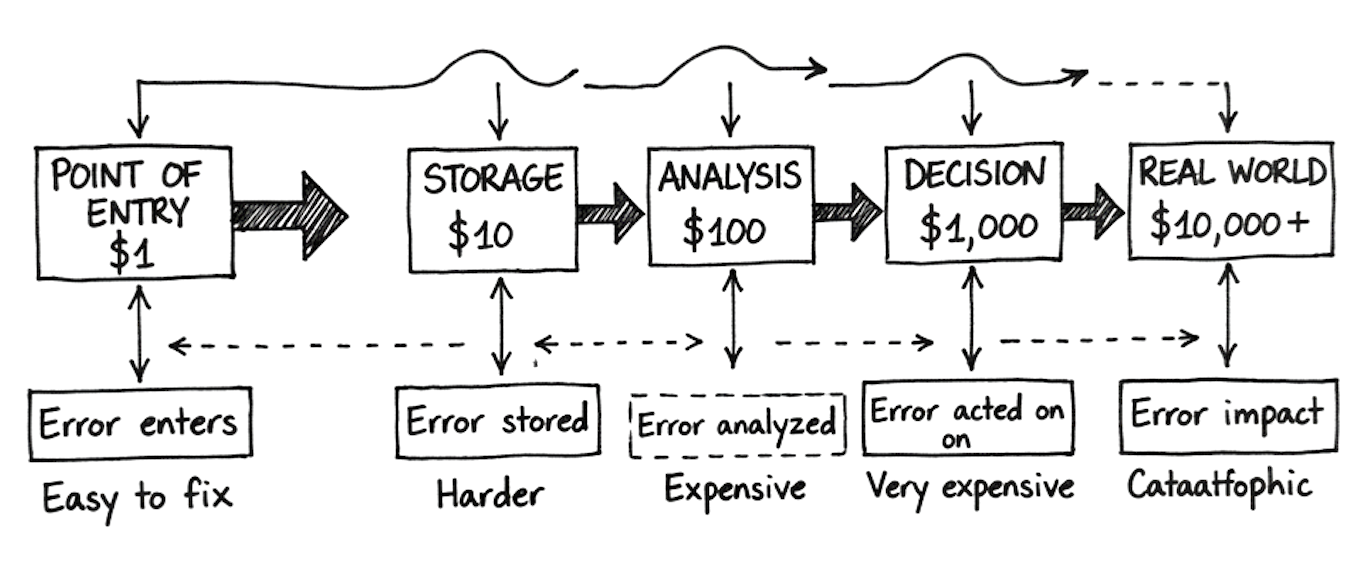
“Exponentially more expensive. IBM estimated that data errors caught at the point of entry cost about $1 to fix. The same errors caught during data storage cost about $10 to fix. Caught during analysis, $100. Caught after a decision has been made and implemented, potentially thousands or millions.”
“And most organizations catch them at which stage?”
“Most organizations catch them when something visibly breaks. Which is the most expensive stage of all.”
The “Good Enough” Trap
S sat back. “So when people say ‘our data is good enough,’ what they’re really saying is...”
“They’re saying they haven’t looked closely enough to see the problems. Or they’ve seen the problems but haven’t calculated the costs. Or they’ve calculated the costs but decided to defer them to the future.”
“Which just makes the future costs higher.”
“Exactly. ‘Good enough’ is a form of technical debt. And like all technical debt, it accrues interest.”
There’s a psychological component to this too. Once an organization has decided that its data is “good enough,” it becomes very hard to revisit that decision. Admitting that data quality is a problem means admitting that past decisions made on that data might have been wrong. It means acknowledging that significant investment might be needed to fix things. It means taking responsibility for something that has no obvious owner.
So people don’t look. They don’t measure. They don’t ask uncomfortable questions. And the problems compound.
“How do you break that cycle?” S asked.
“You make the invisible visible. You measure. You quantify. You show people what ‘good enough’ is actually costing them in terms they can’t ignore.”
Making It Visible
The first step is to stop treating data quality as a binary. Data is not simply “good” or “bad.” It exists on a spectrum across multiple dimensions. And each dimension can be measured.
Last week, we talked about the six dimensions: accuracy, completeness, consistency, timeliness, validity, and uniqueness. Each of these can be expressed as a number.
Accuracy can be measured by sampling records and verifying them against source documents or real-world facts. If you check 1,000 records and 950 are accurate, your accuracy rate is 95 percent. Is that good enough? It depends on the use case. For a marketing mailing list, maybe. For a medical diagnosis system, absolutely not.
Completeness can be measured by counting null or missing values in required fields. If a dataset has 100,000 records and 15,000 are missing a critical field, your completeness rate is 85 percent. What decisions are being made with that 15 percent gap? What are those decisions costing?
Consistency can be measured by comparing how the same entity is represented across different systems. If a customer appears in three databases with three different addresses, you have a consistency problem. How many downstream processes are affected by that inconsistency?
Timeliness can be measured by tracking the age of records relative to their expected refresh rate. If customer data should be updated monthly but hasn’t been touched in two years, you have a timeliness problem. What decisions are being made based on a reality that no longer exists?
Validity can be measured by checking records against defined business rules. Emails should match a certain format. Ages should fall within a certain range. Status codes should come from a defined list. Every violation represents a record that might cause problems downstream.
Uniqueness can be measured by identifying duplicate records. If the same customer appears five times with slightly different information, not only is the data wrong, but any analysis based on customer counts will be overstated.
“Once you have these numbers,” I told S, “you can start having a different conversation. Instead of ‘our data is good enough,’ you can say ‘our data is 94 percent accurate, 85 percent complete, and has a 12 percent duplicate rate.’ Those numbers mean something. They can be tracked over time. They can be tied to business outcomes.”
Connecting Quality to Outcomes
S picked up on something. “You said ‘tied to business outcomes.’ How do you actually make that connection? How do you go from ‘our data has a 12 percent duplicate rate’ to ‘this costs us X dollars’?”
This is where it gets interesting. And where most organizations stop short.
The connection isn’t always direct, but it can be traced. Let me give you a few examples.
Duplicate customer records mean inflated marketing costs. If your database says you have 100,000 customers but 12,000 of those are duplicates, you’re sending 12,000 unnecessary marketing emails. You’re paying for 12,000 extra impressions in advertising campaigns. You’re overstating your customer base to investors and board members. Each of these has a cost.
Incomplete address data means failed deliveries. If 15 percent of your customer addresses are missing or outdated, some percentage of physical shipments will fail. Each failed delivery has a direct cost for reshipping plus an indirect cost for customer frustration and potential churn.
Stale training data means model degradation. If your machine learning model was trained on data that’s two years old and the world has changed since then, your model’s predictions are increasingly wrong. Each wrong prediction has a cost. A fraud detection model that misses fraudulent transactions costs you money. A recommendation engine that suggests irrelevant products costs you sales.
Inconsistent definitions mean misaligned teams. If the marketing team defines “active customer” differently than the finance team, they’re making decisions based on different realities. When those decisions conflict, someone has to clean up the mess. That cleanup has a cost in time, meetings, reconciliation, and delayed execution.
“So the framework,” S said, “is to measure quality, then trace each quality dimension to specific business processes, then estimate the cost of failures in those processes.”
“That’s exactly right. It’s not always precise. Some costs are hard to quantify. But even rough estimates are better than the fiction of ‘good enough.’”
The ROI Question
S paused for a moment. “Okay. So we measure quality. We calculate costs. Then what?”
“Then you can make an actual business case for improvement.”
This is what transforms data quality from an IT concern into a strategic priority. When you can say “we’re losing approximately $2 million per year due to data quality issues, and an investment of $500,000 would reduce that by 60 percent,” you’re speaking a language that executives understand.
The ROI of data quality work is often surprisingly high. The problem is that nobody calculates it. They see the cost of the investment but not the cost of the status quo. So the status quo wins by default.
“But calculating it requires measuring first,” S said.
“Which brings us back to where we started. You can’t manage what you don’t measure. You can’t improve what you can’t quantify. You can’t make a business case for something you can’t express in numbers.”
“So the first step is always measurement.”
“The first step is always measurement.”
What Changes This
S stood up to go. Then stopped.
“Last week you mentioned that this is a governance issue, not just a technical issue. What did you mean by that?”
“I mean that fixing data quality isn’t just about better tools or more cleaning scripts. It’s about organizational change. It’s about who owns data quality, how it’s measured, how it’s incentivized, and how it connects to larger business objectives.”
“That sounds harder than just buying software.”
“It is harder. It’s also the only thing that actually works. You can buy the best data quality tools in the world, but if nobody owns the problem, if there are no standards, if there’s no accountability, those tools will just generate reports that nobody reads.”
“So how do you actually build that? The governance piece?”
“That’s a bigger conversation. For next week?”
S nodded. “Next week.”
Next week: Metrics that matter versus metrics that mislead. Why single numbers are almost always lying to you, and how to build measurement systems that actually drive improvement.
“Good enough” is a bet that the problems you can’t see won’t become problems you can’t ignore. Most organizations lose that bet eventually.
Download: “Data Quality Cost Calculator” — A simple framework to estimate what data quality issues are costing your organization.
Download Data Quality Cost Calculator
Founder of SANJEEVANI AI. ISO/IEC 42001 Lead Auditor. 25+ years in AI, data, and compliance across HealthTech, FinTech, EdTech, and Insurance. Building METRIS, the quantitative AI governance platform.